Missing Data Imputation

missing data
data imputation
simple imputer
KNN imputer
iterative imputer
Author

Kayode Hadilou ADJE

Published

April 28, 2024

Introduction

In this blog post, I will walk you through how to deal with missing data in your machine learning tasks. I will focus on a real world dataset that contains missing data. The dataset is put together to study obesity. It categorizes respondents into four different weight classes based on Body Mass Index (BMI): underweight, normal, overweight, obese. The dataset has 17 variables in total, only 2 of those do not contain missing data. So, it is a good example of a real world scenario for missing data.

TLDR

  • Simple Imputation Mean/Mod: Missing numerical features are replaced by the mean while missing categorical features are replaced by the mode.

  • Simple Imputation with Missingness indicator: In addition to replacing with mean/mode, an extra feature is added to indicate the missingness of the feature.

  • KNN Imputation: Nearest neighbors imputation. For numerical features, n_neighbors of 15 is used. For categorical features, nearest neighbors is preceded by ordinal encoding which is a requirement of the sklearn KNNImputer. In case of categorical features, the n_neighbors parameter is set to 1 to avoid averaging categorical values. Another alternative would be to use a custom distance metric that for 2 1-D arrays returns a distance proportional to the frequency of the mode of the categories. With such metric, we can safely try out n_neighbors>1

  • Iterative Imputation: Numerical and categorical features are treated differently. Similar setting as to KNN imputation is used. The strategy to initiliaze numerical features is set to mean and to mode for categorical features.

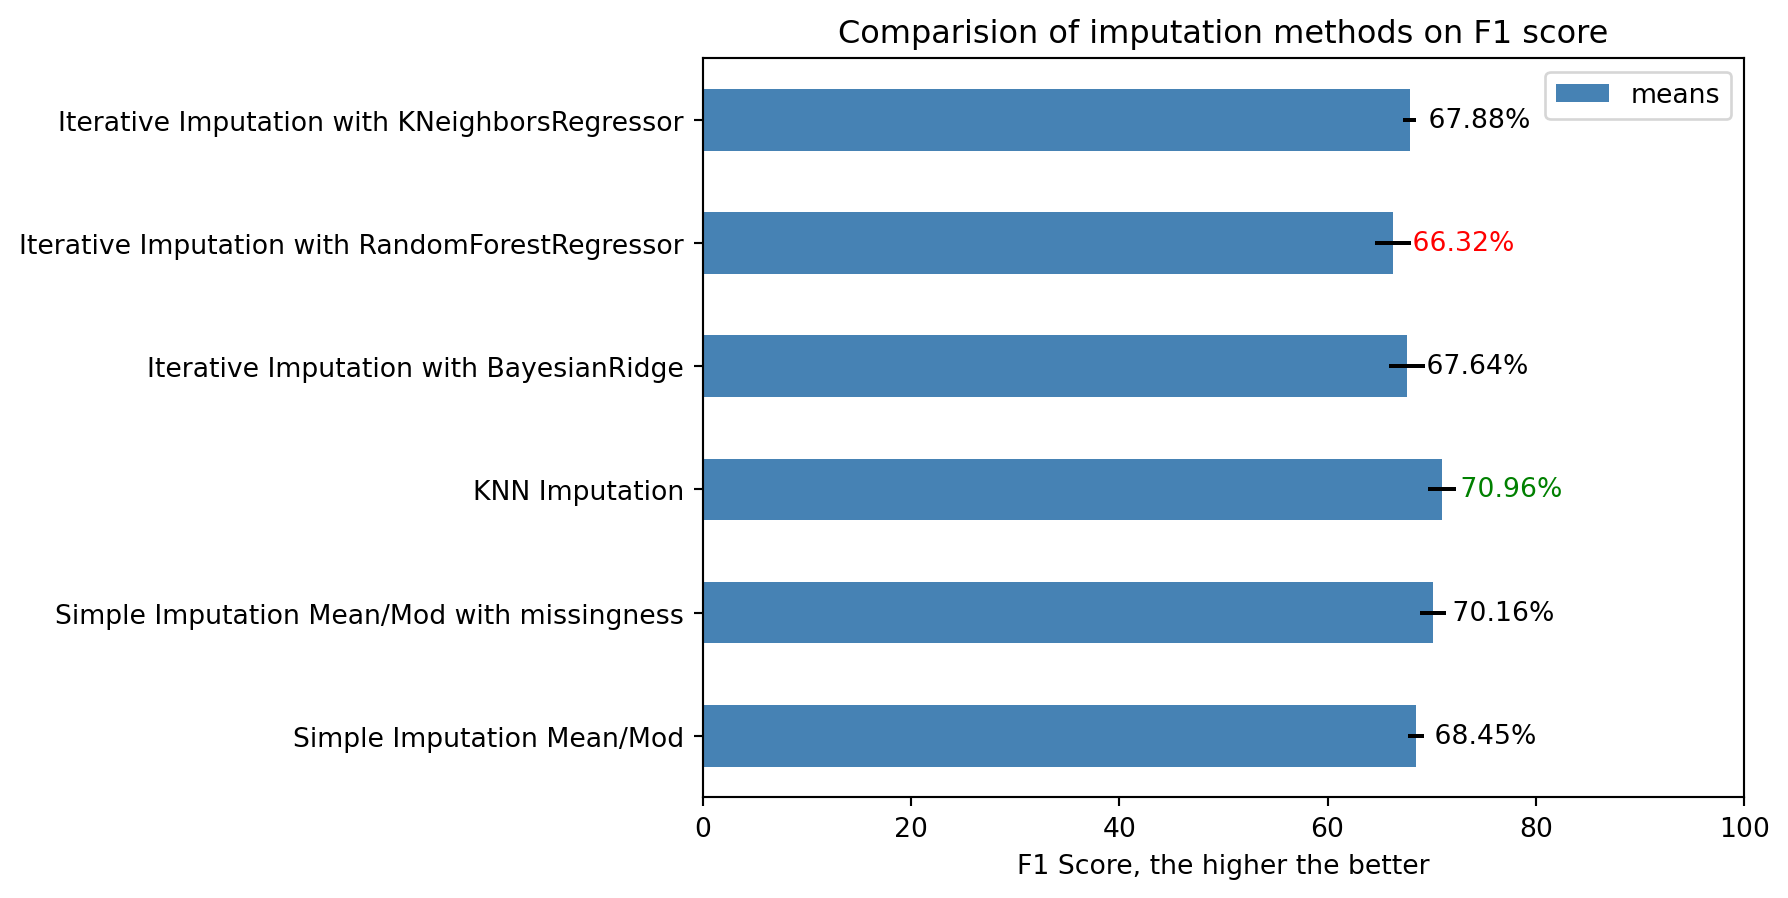
KNN Imputation has the highest F1 score of imputing the missing values. Iterative imputation in the other hand has the lowest F1 score.

Summary of imputation methods

Having chosen an imputation method, we can then proceed to build a machine learning pipeline for our dataset. Below is an example of an end to end pipeline built in python using scikit.learn

Machine Learning Pipeline

TABLE OF CONTENTS

This is going to be a post with necessary code, so let’s import the required python packages.

Code
import logging
logging.basicConfig(
    level=logging.INFO,
    format="%(asctime)s %(levelname)s: %(message)s",
    datefmt="%Y-%m-%dT%H:%M:%S%z",
)
# common libs
import pandas as pd
import numpy as np
from matplotlib import pyplot as plt
import seaborn as sns
import plotly.express as px #for visualization
from scipy.cluster import hierarchy

# extra utils
import missingno as msno # a library to analyze missing data

#inline plot
%matplotlib inline
# plotting backend
pd.options.plotting.backend = "matplotlib" 
# set FutureWarnings off
import warnings
warnings.filterwarnings('ignore', category=FutureWarning)
warnings.filterwarnings('ignore', category=UserWarning)
from sklearn.exceptions import ConvergenceWarning
# warnings.filterwarnings('ignore', category=ConvergenceWarning) #sklearn.exceptions.ConvergenceWarning

Dataset imputation

First thing first, we can use pandas to open our tab seperated obesity dataset which can be found here

Code
df = pd.read_csv("../../resources/obesity.data.txt", sep="\t")
df.sample(20)
Gender Age Height Weight FHO FAVC FCVC NCP CAEC SMOKE CH2O SCC FAF TUE CALC MTRANS WeightClass
1393 Male 25.036269 NaN 121.244969 yes NaN 2.630137 3.000000 NaN no NaN no 1.356468 NaN NaN Public_Transportation 4
1863 Female 26.000000 1.650000 60.000000 no no 3.000000 NaN Always NaN NaN no 2.000000 NaN no Walking 2
2087 Female 29.000000 1.700000 78.000000 yes yes 3.000000 3.000000 Sometimes no NaN NaN 2.000000 1.000000 Frequently Automobile 3
593 Male NaN NaN 105.000000 NaN yes 3.000000 1.000000 no no 3.000000 NaN 3.000000 1.000000 Frequently Automobile 4
815 Female NaN 1.640688 46.655622 yes yes 3.000000 3.111580 NaN no 2.721769 NaN 1.442870 0.000000 no Public_Transportation 1
1030 Female 30.000000 NaN NaN yes yes 2.000000 3.000000 NaN no 1.000000 no NaN NaN Sometimes NaN 3
2000 Male NaN 1.758382 112.100740 yes yes 1.387489 3.000000 NaN no 2.017712 no 0.000000 0.731257 Sometimes NaN 4
555 Male NaN 1.720000 72.000000 yes yes 3.000000 3.000000 Always no NaN yes NaN 0.000000 Sometimes Automobile 2
1813 Female 22.142432 NaN 42.848033 NaN NaN 3.000000 2.581015 NaN no NaN no NaN 0.000000 NaN Public_Transportation 1
1045 Male 23.000000 1.720000 66.000000 yes NaN 2.000000 3.000000 Sometimes no 2.000000 NaN 0.000000 1.000000 Sometimes Walking 2
33 Male 18.128206 1.778447 80.273807 yes yes NaN 3.000000 Sometimes no 2.000000 no 2.707882 0.000000 NaN Public_Transportation 3
1912 Female NaN NaN 82.000000 yes NaN 2.587789 1.482103 Sometimes NaN 1.911664 NaN NaN NaN Sometimes NaN 4
140 Male 30.958051 NaN 128.856677 yes yes 2.633855 3.000000 NaN no NaN no NaN 0.424612 Sometimes NaN 4
290 Female NaN 1.635905 NaN yes yes 3.000000 3.000000 NaN NaN 2.511399 no 0.000000 NaN NaN NaN 4
395 Male NaN 1.720000 53.000000 yes yes 2.000000 3.000000 Sometimes no 2.000000 NaN NaN 2.000000 Sometimes Public_Transportation 1
233 Male NaN 1.815409 85.302146 yes yes 2.987148 NaN Sometimes no NaN no 2.060415 0.598999 NaN Public_Transportation 3
81 Male NaN NaN 88.431954 yes yes 2.000000 NaN Sometimes no NaN NaN 0.893362 0.276364 NaN Public_Transportation 3
103 Female 26.000000 NaN NaN yes yes 3.000000 NaN NaN no 2.613928 no 0.000000 NaN NaN Public_Transportation 4
1249 Female 23.000000 NaN 84.134712 yes yes NaN 1.496776 Sometimes no 2.776724 no 0.782416 NaN no Public_Transportation 4
9 Male 24.178638 1.867410 121.684311 yes yes 2.954417 2.657720 NaN NaN NaN no 0.870056 0.000000 Sometimes Public_Transportation 4

Dataset exploration

The dataset contains both categorical and numerical variables.

  • Categorical features

    • Gender: > {female, male}

    • FHO: Has a family member suffered or suffers from overweight? > {yes, no}

    • FAVC: Do you eat high caloric food frequently? > {yes, no}

    • CAEC: Do you eat any food between meals? > {no, sometimes, frequently, always}

    • SMOKE: DO you smoke? > {yes, no}

    • SCC: Do you monitor the calories you eat daily? > {yes, no}

    • CALC: How often do you drink alcohol? {no, sometimes, frequently, always}

    • MTRANS: Which transportation do you usually use? > {automobile, motorbike, bike, public_transportation, walkiing}

  • Numerical features

    • Age

    • Height

    • Weight

    • FCVC: Do you usually eat vegetables in your meals?

    • CH20: How much water do you drink daily?

    • FAF: How often do you have physical activity?

    • TUE: How much time do you use technological devices such as cell phone, videogames, television, computer and others?

  • Dependent variable

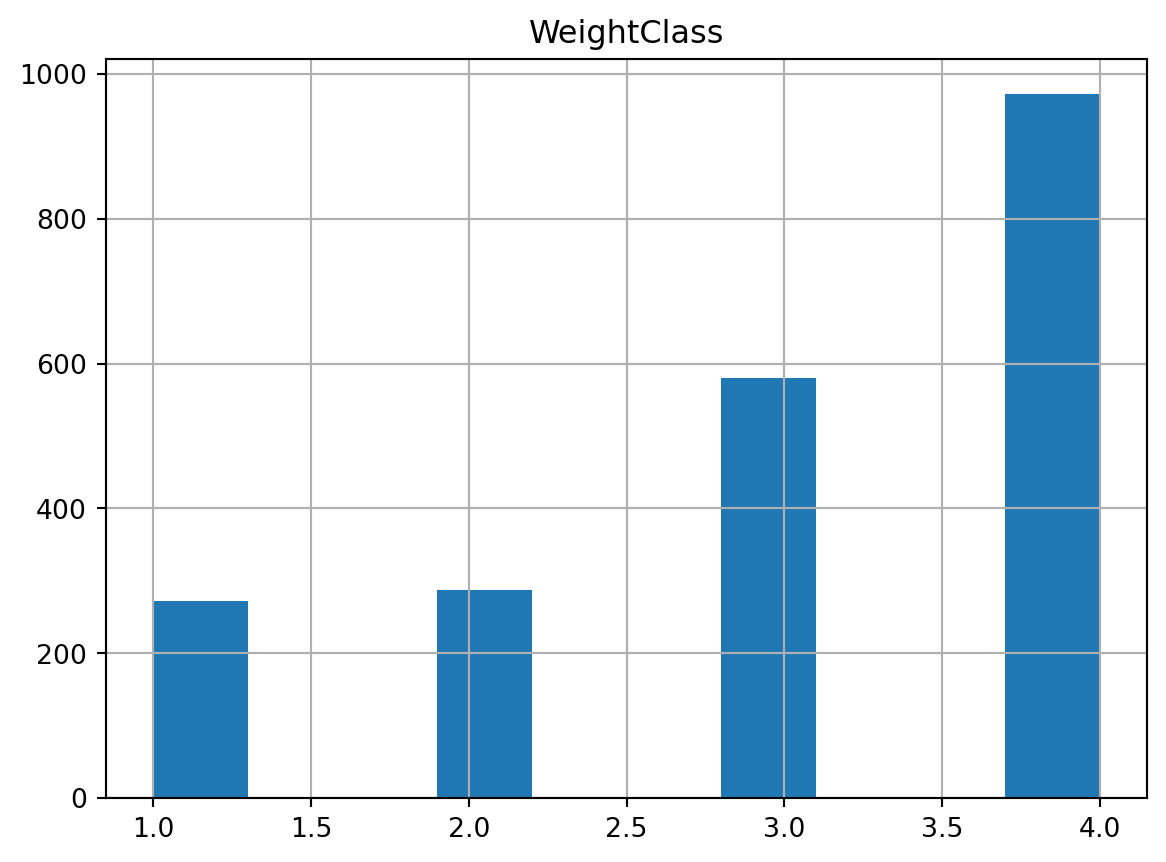
    • WeightClass: 1 to 4 respectively: underweight, normal, overweight and obese.
Code
numeric_vars = ['Age', 'Height', 'Weight', 'FCVC', 'NCP', 'CH2O', 'FAF', 'TUE']
categoric_vars = ['Gender', 'FHO', 'FAVC', 'CAEC', 'SMOKE', 'SCC', 'CALC', 'MTRANS', "WeightClass"]

Description per feature: case of numerical features

Let’s have a quick look at the statistics of numerical features. We can achieve this with the .describe() function in pandas.

Code
# does not include missing values
df[numeric_vars].describe().T
count mean std min 25% 50% 75% max
Age 1573.0 24.253224 6.276876 14.00 19.920629 22.693989 26.000000 55.137881
Height 1465.0 1.701895 0.093146 1.45 1.629010 1.702825 1.767186 1.980000
Weight 1514.0 86.366451 26.468326 39.00 65.238481 82.353453 107.009192 173.000000
FCVC 1676.0 2.417900 0.535480 1.00 2.000000 2.348344 3.000000 3.000000
NCP 1632.0 2.691339 0.778604 1.00 2.690432 3.000000 3.000000 4.000000
CH2O 1542.0 2.007783 0.608349 1.00 1.591468 2.000000 2.466337 3.000000
FAF 1504.0 1.020704 0.853450 0.00 0.143955 1.000000 1.677413 3.000000
TUE 1536.0 0.650987 0.602905 0.00 0.000000 0.619123 1.000000 2.000000

Box plots are another visualisation tool we can use to quickly understand the statistics of each variable and look for possible outliers.

Code
cols = ['Height', 'FCVC', 'NCP', 'CH2O', 'FAF', 'TUE']
pd.options.plotting.backend = "plotly" 
df[cols].boxplot(title="Box Plots")
Code
df[["Age"]].boxplot(title="Box Plot Age")
Code
df[["Weight"]].boxplot(title="Box Plot Weight")
Code
pd.options.plotting.backend = "matplotlib" 

In case of Age, we can see few data points above 1.5*Q3, it means there are old participants in the survey whose age was outside the range of the most observed ages. However, this is not a concern for our goal.

Unique values per features: case of categorical features

Now, we can a have a look at possible outcomes for each categorical variable.

Code
for col in df.columns:
    if col not in numeric_vars:
        print(f"Unique values for {col}: {df[col].unique()}\n")
Unique values for Gender: ['Female' 'Male']

Unique values for FHO: [nan 'yes' 'no']

Unique values for FAVC: ['no' nan 'yes']

Unique values for CAEC: [nan 'Sometimes' 'Always' 'Frequently' 'no']

Unique values for SMOKE: ['no' nan 'yes']

Unique values for SCC: ['no' nan 'yes']

Unique values for CALC: ['no' 'Sometimes' nan 'Frequently' 'Always']

Unique values for MTRANS: ['Public_Transportation' 'Automobile' nan 'Walking' 'Motorbike' 'Bike']

Unique values for WeightClass: [1 2 4 3]

Independent variables by types

  • Eating habits:
    • FAVC i.e frequent consumption of high caloric food
    • FCVC i.e frequency of consumption of vegetables
    • NCP i.e number of main meals
    • CAEC i.e consumption of food between meals
    • CH20 i.e consumption of water daily
    • CALC i.e consumption of alcohol
    • Smoke i.e whether the respondent smokes or not
  • Physical condition:
    • SCC i.e calorie consumption monitoring
    • FAF i.e physical activity frequency
    • TUE i.e time using electronic devices
    • MTRANS i.e means of transportation
  • Demographic variables
    • Gender
    • Age
    • Height
    • Weight
    • FHO i.e whether or not a family has suffered or suffers from obesity
Code
df['FCVC'].nunique()
645
Code
df['NCP'].nunique()
489
Code
df['FAF'].nunique()
863
Code
df['TUE'].nunique()
825

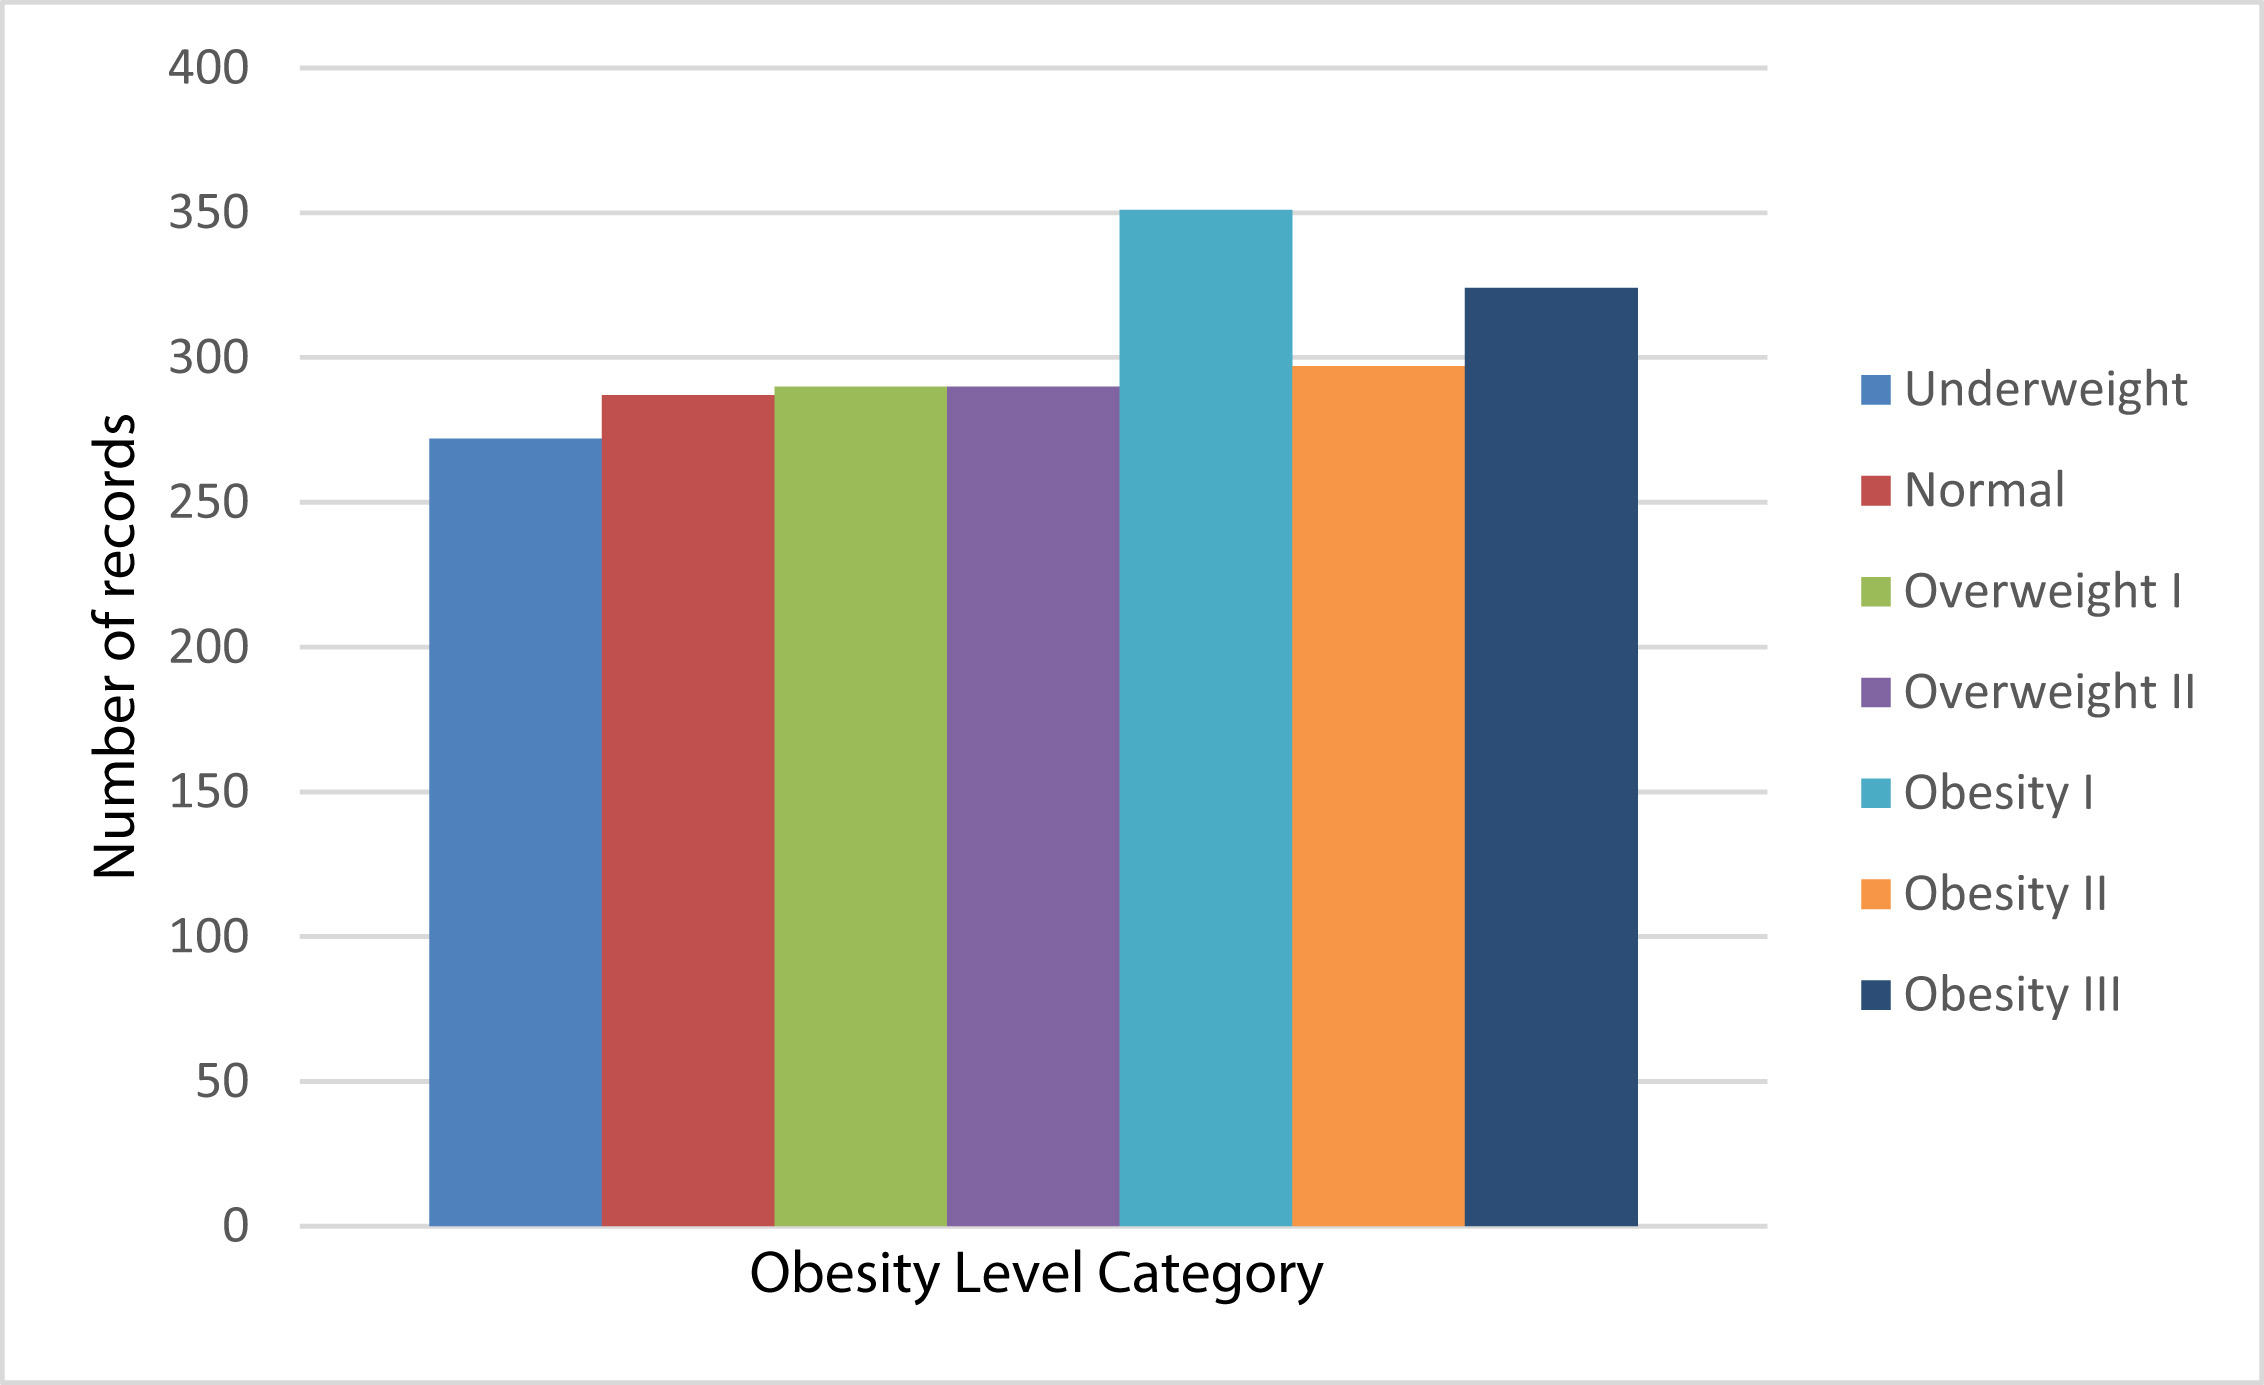
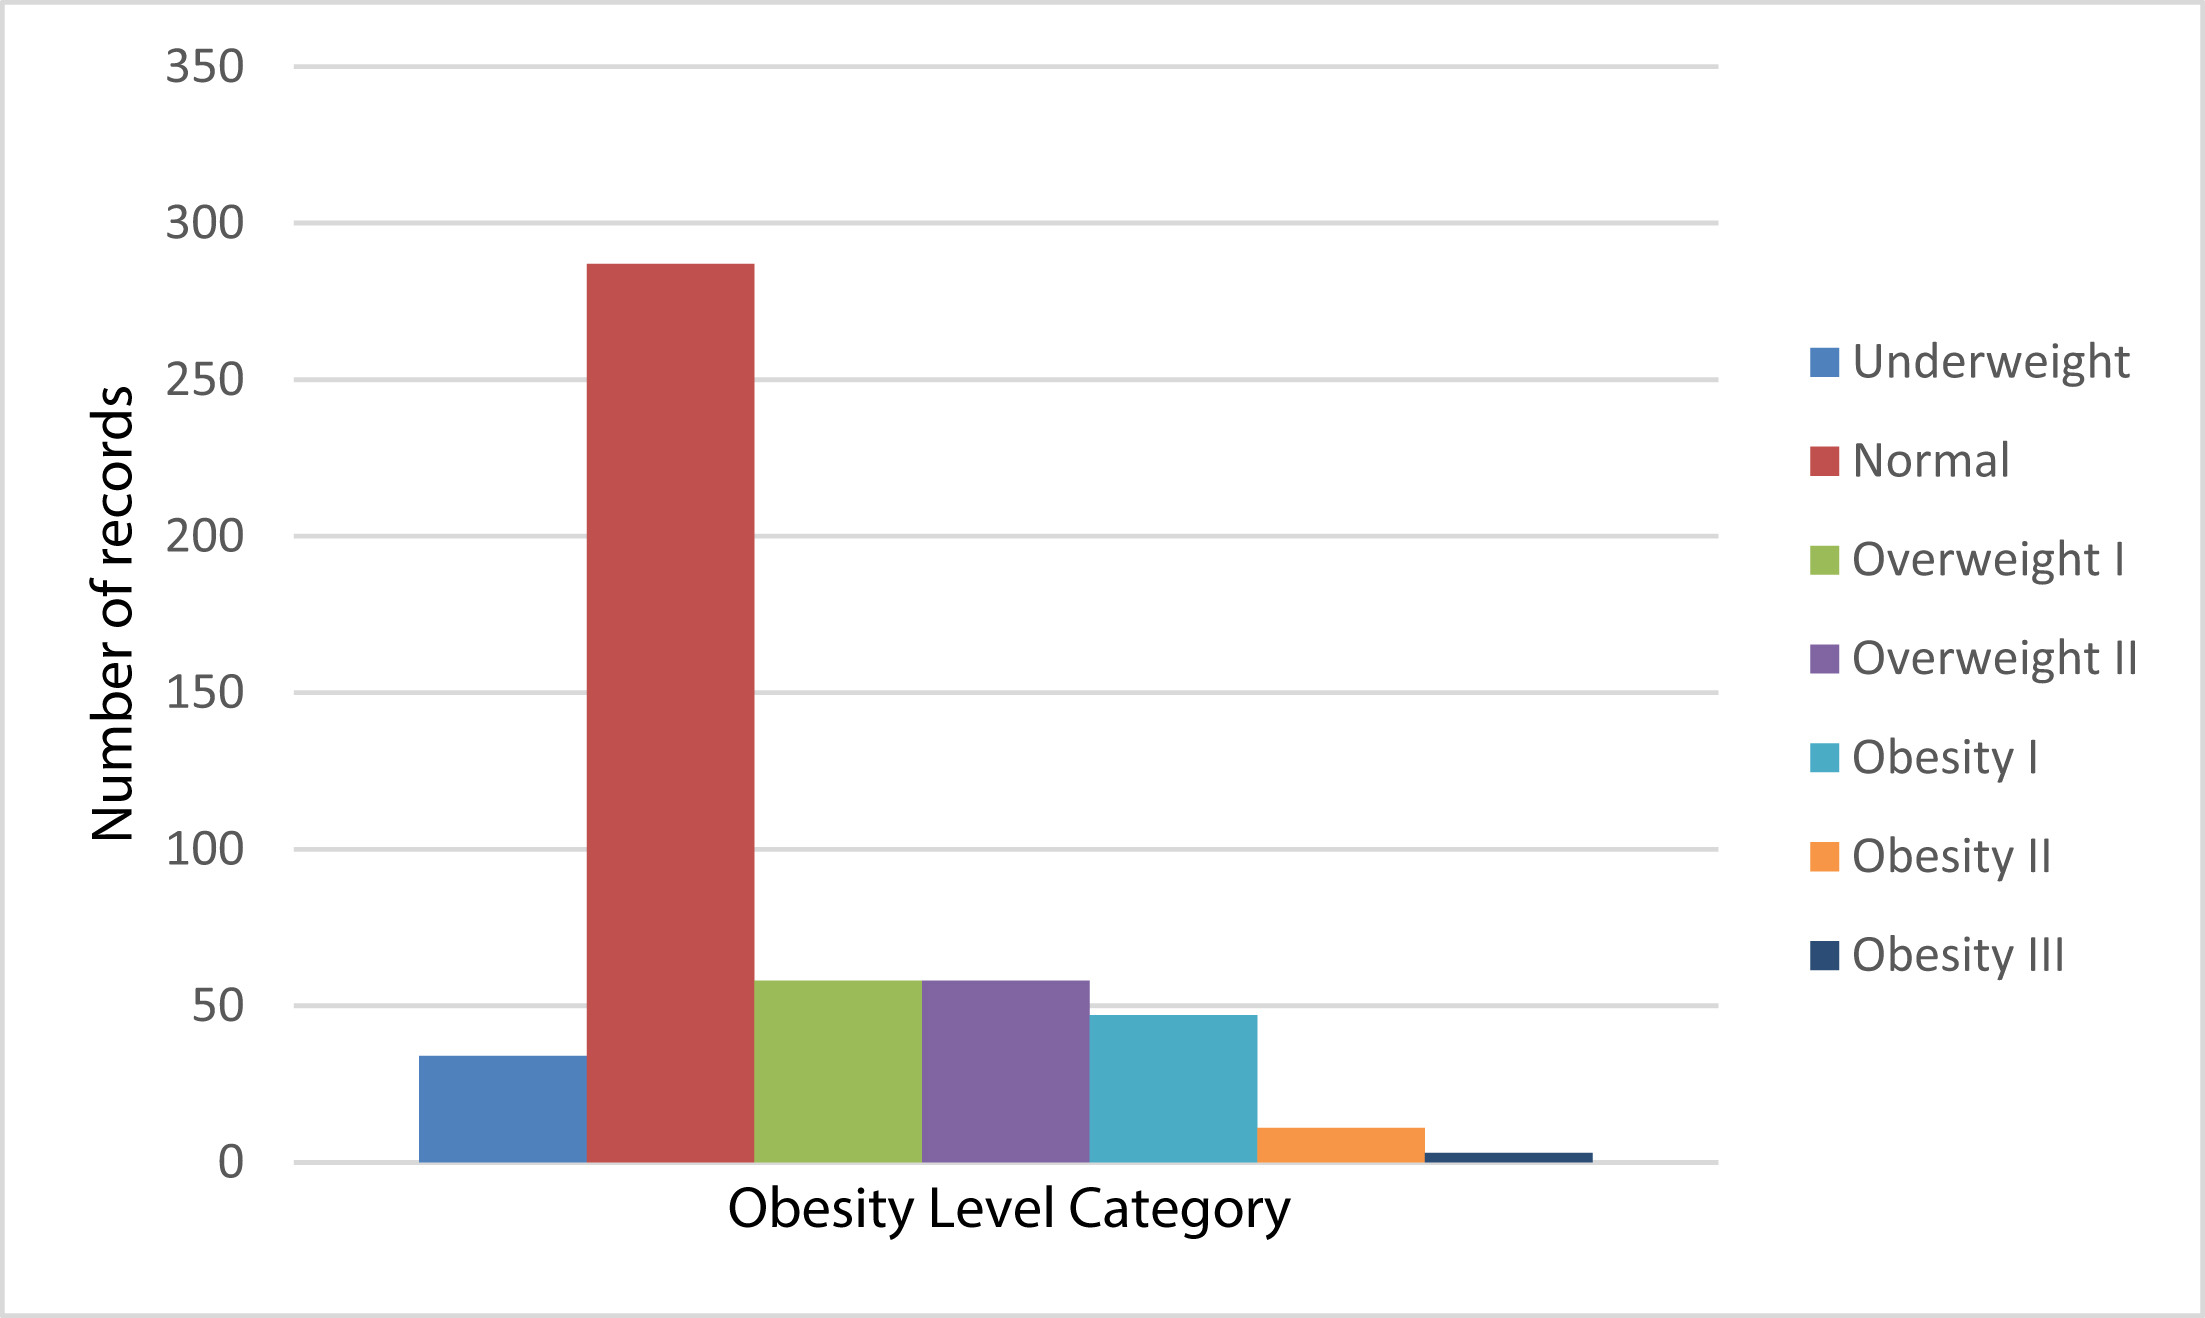
FCVC, NCP, FAF and TUE are features which could have been categorical instead of numerical. Looking at the sample initial questionnaire, the answers to those questions could only be one of the few (<5) options provided in the survey. The original response was unbalanced (fig 1) in favor of the normal weight class. Authors found useful to use SMOTE algorithm to oversample the data (fig 2).

Unbalanced survey Fig 1: Original unbalanced distribution [1]

balanced.jpg Fig 2: Oversampled balanced distribution [1]

At least in python, there are variants of the default SMOTE that can handle both continuous and categorical features. My guess is that the features mentioned above were encoded as numeric features during oversampling which led to the intermediate values observed.

It is unlikely that we want the intermediate values as it is impossible to get real world data with such values. This should be considered in model building.

References

[1]F. M. Palechor and A. de la H. Manotas, “Dataset for estimation of obesity levels based on eating habits and physical condition in individuals from Colombia, Peru and Mexico,” Data in Brief, vol. 25, p. 104344, Aug. 2019, doi: https://doi.org/10.1016/j.dib.2019.104344. ‌

Missing values analysis

Which variables has missing values?

Code
df.info();
<class 'pandas.core.frame.DataFrame'>
RangeIndex: 2111 entries, 0 to 2110
Data columns (total 17 columns):
 #   Column       Non-Null Count  Dtype  
---  ------       --------------  -----  
 0   Gender       2111 non-null   object 
 1   Age          1573 non-null   float64
 2   Height       1465 non-null   float64
 3   Weight       1514 non-null   float64
 4   FHO          1483 non-null   object 
 5   FAVC         1565 non-null   object 
 6   FCVC         1676 non-null   float64
 7   NCP          1632 non-null   float64
 8   CAEC         1458 non-null   object 
 9   SMOKE        1609 non-null   object 
 10  CH2O         1542 non-null   float64
 11  SCC          1475 non-null   object 
 12  FAF          1504 non-null   float64
 13  TUE          1536 non-null   float64
 14  CALC         1610 non-null   object 
 15  MTRANS       1502 non-null   object 
 16  WeightClass  2111 non-null   int64  
dtypes: float64(8), int64(1), object(8)
memory usage: 280.5+ KB
Code
# percent of missing values per variable
df.isna().sum() * 100 / df.shape[0]
Gender          0.000000
Age            25.485552
Height         30.601611
Weight         28.280436
FHO            29.748934
FAVC           25.864519
FCVC           20.606348
NCP            22.690668
CAEC           30.933207
SMOKE          23.780199
CH2O           26.954050
SCC            30.127901
FAF            28.754145
TUE            27.238276
CALC           23.732828
MTRANS         28.848887
WeightClass     0.000000
dtype: float64
  • All independent variables except Gender (male/female) have missing values
  • The dependent variable WeightClass has no missing value which is good.
  • The percent of missing values varies between 20% to 30% of the overall data.
Code
# barplot of missing values per column
msno.bar(df, color='steelblue');

The bar plot shows the percent of non missing values per column together with the absolute number of no nan. A nice visual summary of df.info()

Are missing data random or not?

Types of missing values [1]

  • MCAR: Missing completely at random. The probability of missingness is random meaning independent of data observed or missed. Example of data missing due to equipment/sensoric failures.

  • MAR: Missing at random. The probability of missingness depends on the observed data but not on the missing values. This means we can explain the missing values by looking at the data for which there exist complete information. The is some pattern in the sub-samples for which data is missing.

  • MNAR: Missing not at random. The probability of missingness is also related to the unobserved (missed) values in the dataset.

While it is acceptable to ignore rows/columns with missing values in case of MCAR, doing so in case of MAR and MNAR could potentially introduce bias in the data distribution hence it is advised to work on imputing missing data.

References

[1] D. B. RUBIN, “Inference and missing data,” Biometrika, vol. 63, no. 3, pp. 581–592, 1976, doi: https://doi.org/10.1093/biomet/63.3.581. ‌

Nullity correlations check

Pairwise check

In this part, we want to check if there are nullity correlations between pairwise features.

Code
df_null = df.iloc[:, [i for i, n in enumerate(np.var(df.isnull(), axis='rows')) if n > 0]]
corr_mat = df_null.isnull().corr()
px.imshow(corr_mat,  width=700, height=500,color_continuous_scale='magenta', title='Nullity Correlation between variables')

Nullity correlation heatmap. It shows how strongly the presence or absence of one feature affects the presence of another.

  • -1 ==> negative nullity correlation (if one appears, the other does not)

  • 0 ==> no existing nullity correlation (one appearing does not affect the other)

  • 1 ==> positive nullity correlation (both variables appears together)

Code
corr_mat[corr_mat >= 0.05] # 5% positive threshold
Age Height Weight FHO FAVC FCVC NCP CAEC SMOKE CH2O SCC FAF TUE CALC MTRANS
Age 1.0 NaN NaN NaN NaN NaN NaN NaN NaN NaN NaN NaN NaN NaN NaN
Height NaN 1.0 NaN NaN NaN NaN NaN NaN NaN NaN NaN NaN NaN NaN NaN
Weight NaN NaN 1.0 NaN NaN NaN NaN NaN NaN NaN NaN NaN NaN NaN NaN
FHO NaN NaN NaN 1.0 NaN NaN NaN NaN NaN NaN NaN NaN NaN NaN NaN
FAVC NaN NaN NaN NaN 1.0 NaN NaN NaN NaN NaN NaN NaN NaN NaN NaN
FCVC NaN NaN NaN NaN NaN 1.0 NaN NaN NaN NaN NaN NaN NaN NaN NaN
NCP NaN NaN NaN NaN NaN NaN 1.0 NaN NaN NaN NaN NaN NaN NaN NaN
CAEC NaN NaN NaN NaN NaN NaN NaN 1.0 NaN NaN NaN NaN NaN NaN NaN
SMOKE NaN NaN NaN NaN NaN NaN NaN NaN 1.0 NaN NaN NaN NaN NaN NaN
CH2O NaN NaN NaN NaN NaN NaN NaN NaN NaN 1.0 NaN NaN NaN NaN NaN
SCC NaN NaN NaN NaN NaN NaN NaN NaN NaN NaN 1.0 NaN NaN NaN NaN
FAF NaN NaN NaN NaN NaN NaN NaN NaN NaN NaN NaN 1.0 NaN NaN NaN
TUE NaN NaN NaN NaN NaN NaN NaN NaN NaN NaN NaN NaN 1.0 NaN NaN
CALC NaN NaN NaN NaN NaN NaN NaN NaN NaN NaN NaN NaN NaN 1.0 NaN
MTRANS NaN NaN NaN NaN NaN NaN NaN NaN NaN NaN NaN NaN NaN NaN 1.0
Code
corr_mat[corr_mat <= -0.05] # 5% negative threshold
Age Height Weight FHO FAVC FCVC NCP CAEC SMOKE CH2O SCC FAF TUE CALC MTRANS
Age NaN NaN NaN NaN NaN NaN NaN NaN NaN NaN NaN NaN NaN NaN NaN
Height NaN NaN NaN NaN NaN NaN NaN NaN NaN NaN NaN NaN NaN NaN NaN
Weight NaN NaN NaN NaN NaN NaN NaN NaN NaN NaN NaN NaN NaN NaN NaN
FHO NaN NaN NaN NaN NaN NaN NaN NaN NaN NaN NaN NaN NaN NaN -0.05757
FAVC NaN NaN NaN NaN NaN NaN -0.051377 NaN NaN NaN NaN NaN NaN NaN NaN
FCVC NaN NaN NaN NaN NaN NaN NaN NaN NaN NaN NaN NaN NaN NaN NaN
NCP NaN NaN NaN NaN -0.051377 NaN NaN NaN NaN NaN NaN NaN NaN NaN NaN
CAEC NaN NaN NaN NaN NaN NaN NaN NaN NaN NaN NaN NaN NaN NaN NaN
SMOKE NaN NaN NaN NaN NaN NaN NaN NaN NaN NaN NaN NaN NaN NaN NaN
CH2O NaN NaN NaN NaN NaN NaN NaN NaN NaN NaN NaN NaN NaN NaN NaN
SCC NaN NaN NaN NaN NaN NaN NaN NaN NaN NaN NaN NaN NaN NaN NaN
FAF NaN NaN NaN NaN NaN NaN NaN NaN NaN NaN NaN NaN NaN NaN NaN
TUE NaN NaN NaN NaN NaN NaN NaN NaN NaN NaN NaN NaN NaN NaN NaN
CALC NaN NaN NaN NaN NaN NaN NaN NaN NaN NaN NaN NaN NaN NaN NaN
MTRANS NaN NaN NaN -0.05757 NaN NaN NaN NaN NaN NaN NaN NaN NaN NaN NaN

Looking at the nullity correlation values between features, in 5% of the cases, if FHO is present, MTRANS is not; similarly if NCP is present FAVC is not.

Those values are too small to allow us to conclude on any type of absolute nullity correlation between pairwise variables.

Group wise checks

Since we could not gain any insight on pairwise nullity correlation, what about looking at group-wise nullity correlations among features?

Code
x = np.transpose(df.drop(['WeightClass', 'Gender'], axis=1).isnull().astype(bool).values)
#hamming = proportion of elements disagrees
# jaccard dissimilirity = 1 - Jaccard index = correlation
z = hierarchy.linkage(x, method='complete', metric="correlation") 
fig = plt.figure(figsize=(25, 10))
hierarchy.dendrogram(z, labels=df.drop(['WeightClass', 'Gender'], axis=1).columns, orientation='top', distance_sort='descending');
plt.ylabel('Average distance')
plt.xlabel('Clusters')
plt.show()

Looking at the correlation matrix, It wasn’t possible to find any pairwise nullity similarity between features so in the figure above, we looked into deeper nullity correlation among group of variables.

Hierarchical clustering is used to bins features against one another with regards to their nullity correlation (two features with same nullity bits are closer than 2 features with different nullity bits, thanks to the similarity metric we used).

In each step, the clustering algorithm splits up the features by minimizing the distance among clusters. If the set of variables were identical, their total dissimilarity distance will be close to zero hence their average distance in y axis will also be close to zero.

From the dendrogram, we can see that SMOKE and CAEC have the same correlation, same for the set of SCC, FCVC, Age, FAVC and the set of MTRANS, Height, CALC. While the features are groupped into clusters, the co-absence/dissimilarity is too high making it difficult to conclude on any co-nullity pattern among variables or groups of variables.

At this step, we do not have evidence to point out to a specific type of missingness. We will proceed to the perform imputation on the dataset.

Imputation

Code
from sklearn.experimental import enable_iterative_imputer 
from sklearn.impute import IterativeImputer, KNNImputer, SimpleImputer

from sklearn.linear_model import LogisticRegression, BayesianRidge
from sklearn.neighbors import KNeighborsRegressor
from sklearn.ensemble import RandomForestRegressor, RandomForestClassifier

from sklearn.base import TransformerMixin

from sklearn.model_selection import cross_val_score, cross_validate, StratifiedKFold,  train_test_split, GridSearchCV, RandomizedSearchCV
from sklearn.pipeline import make_pipeline

from sklearn.metrics import confusion_matrix, classification_report, ConfusionMatrixDisplay
from sklearn.metrics import precision_score
from sklearn.metrics import r2_score

from sklearn.preprocessing import MinMaxScaler,OneHotEncoder, LabelEncoder, OrdinalEncoder
from sklearn.compose import ColumnTransformer
from sklearn.pipeline import Pipeline

N_SPLITS = 5

Scoring function and Feature Transformations

In order to compare different imputation methods, we will define a pipeline that transform the dataset with a given imputation method and perform simple logistic regression. We can then score our method with our customized Stratified cross validation F1 score.

Code
def score_fn_cv(clf, df, target="WeightClass"):
    skf = StratifiedKFold(n_splits=N_SPLITS)
    features = df.drop(target, axis=1)
    labels = df[target]
    scores = cross_val_score(clf, features, labels, cv=skf, scoring='f1_micro')
    
    return scores.mean(), scores.std()

NUM_FEATURES = ["Age", "Height", "Weight", "FCVC", "NCP", "CH2O", "FAF", "TUE"]
CAT_FEATURES = ["Gender", "FHO", "FAVC", "CAEC", "SMOKE", "SCC", "CALC", "MTRANS"]

FEATURES = NUM_FEATURES + CAT_FEATURES

def end2end_pipeline(num_imputer, cat_imputer, num_features=NUM_FEATURES, cat_features=CAT_FEATURES):

    numerical_transformer = Pipeline(
        steps=[('encoder', MinMaxScaler()), ("imputer", num_imputer)]
    )

    categorical_transformer = Pipeline(
        steps=[("ordinal_encode", OrdinalEncoder(handle_unknown='use_encoded_value', unknown_value=np.nan)), ("imputer", cat_imputer), ('encoder', OneHotEncoder(drop='first', handle_unknown='ignore'))]
    )
    # 

    preprocessor = ColumnTransformer(transformers=[
        ('num', numerical_transformer, num_features), 
        ('cat', categorical_transformer, cat_features)
    ])

    clf = Pipeline(
        steps=[("preprocessor", preprocessor), ("classifier", LogisticRegression(max_iter=2000))]
    )

    return clf, preprocessor

scores = {} # to store mean of f1 scores
stds = {} # to store std of f1 scores

Dropping rows with missing values

Code
print(f"Percent of rows with at least one missing value is {round(df.isnull().any(axis = 1).sum() / df.shape[0] * 100, 2)}%")
Percent of rows with at least one missing value is 98.96%

This makes it impossible to drop missing values from rows as we won’t have enough data for training

Simple Imputer (Mean && Mode)

The simple imputer replaces missing values with their mean in case of numerical feature and mode if the feature is categorical.

Code
clf, preprocessor = end2end_pipeline(
        num_imputer=SimpleImputer(strategy="mean", missing_values=np.nan), 
        cat_imputer=SimpleImputer(strategy="most_frequent", missing_values=np.nan)
)
mean_f1, std_f1 = score_fn_cv(df=df.copy(), clf=clf, target="WeightClass")
scores["Simple Imputation Mean/Mod"] = mean_f1
stds["Simple Imputation Mean/Mod"] = std_f1

print(f"Simple Imputation Mean/Mod: F1 score = {100*scores['Simple Imputation Mean/Mod']:.2f}%")
clf
Simple Imputation Mean/Mod: F1 score = 68.45%
Pipeline(steps=[('preprocessor',
                 ColumnTransformer(transformers=[('num',
                                                  Pipeline(steps=[('encoder',
                                                                   MinMaxScaler()),
                                                                  ('imputer',
                                                                   SimpleImputer())]),
                                                  ['Age', 'Height', 'Weight',
                                                   'FCVC', 'NCP', 'CH2O', 'FAF',
                                                   'TUE']),
                                                 ('cat',
                                                  Pipeline(steps=[('ordinal_encode',
                                                                   OrdinalEncoder(handle_unknown='use_encoded_value',
                                                                                  unknown_value=nan)),
                                                                  ('imputer',
                                                                   SimpleImputer(strategy='most_frequent')),
                                                                  ('encoder',
                                                                   OneHotEncoder(drop='first',
                                                                                 handle_unknown='ignore'))]),
                                                  ['Gender', 'FHO', 'FAVC',
                                                   'CAEC', 'SMOKE', 'SCC',
                                                   'CALC', 'MTRANS'])])),
                ('classifier', LogisticRegression(max_iter=2000))])
In a Jupyter environment, please rerun this cell to show the HTML representation or trust the notebook.
On GitHub, the HTML representation is unable to render, please try loading this page with nbviewer.org.
We can also look at how the simple imputater transforms the data by calling fit_transform() on df

Code
pd.DataFrame(preprocessor.fit_transform(df.drop("WeightClass", axis=1)), columns=preprocessor.get_feature_names_out()).sample(20)
num__Age num__Height num__Weight num__FCVC num__NCP num__CH2O num__FAF num__TUE cat__Gender_1.0 cat__FHO_1.0 ... cat__CAEC_3.0 cat__SMOKE_1.0 cat__SCC_1.0 cat__CALC_1.0 cat__CALC_2.0 cat__CALC_3.0 cat__MTRANS_1.0 cat__MTRANS_2.0 cat__MTRANS_3.0 cat__MTRANS_4.0
946 0.098906 0.637334 0.097015 0.708950 0.666667 0.503891 0.340235 0.500000 1.0 1.0 ... 0.0 0.0 0.0 0.0 1.0 0.0 0.0 0.0 1.0 0.0
1672 0.123401 0.475274 0.227833 0.639322 0.000000 0.503891 0.333333 0.642687 1.0 1.0 ... 0.0 0.0 0.0 0.0 1.0 0.0 0.0 0.0 1.0 0.0
1418 0.249240 0.475274 0.380597 0.533908 0.666667 0.041042 0.000000 0.961182 1.0 1.0 ... 0.0 0.0 0.0 0.0 1.0 0.0 0.0 0.0 1.0 0.0
435 0.249240 0.398896 0.610061 1.000000 0.666667 0.455195 0.072485 0.325494 0.0 1.0 ... 0.0 0.0 0.0 0.0 1.0 0.0 0.0 0.0 1.0 0.0
135 0.518308 0.622642 0.472134 0.893795 0.038188 1.000000 0.903446 0.286093 1.0 1.0 ... 0.0 0.0 0.0 0.0 1.0 0.0 0.0 0.0 0.0 0.0
1073 0.218776 0.475274 0.338361 0.588621 0.563780 0.857786 0.743370 0.035449 0.0 1.0 ... 0.0 0.0 0.0 0.0 1.0 0.0 0.0 0.0 1.0 0.0
1756 0.198769 0.504642 0.093224 0.743094 0.563780 0.032189 0.735352 0.979044 0.0 1.0 ... 0.0 0.0 0.0 0.0 0.0 1.0 0.0 0.0 1.0 0.0
1439 0.130399 0.475274 0.832213 0.708950 0.666667 0.652787 0.340235 0.431522 0.0 1.0 ... 0.0 0.0 0.0 0.0 1.0 0.0 0.0 0.0 1.0 0.0
350 0.123763 0.475274 0.353481 1.000000 0.666667 0.503891 0.340235 0.000000 0.0 0.0 ... 0.0 0.0 1.0 0.0 1.0 0.0 0.0 0.0 1.0 0.0
1513 0.187076 0.576370 0.707989 1.000000 0.666667 0.479644 0.477717 0.455668 0.0 1.0 ... 0.0 0.0 0.0 0.0 1.0 0.0 0.0 0.0 1.0 0.0
1682 0.291702 0.302311 0.492063 1.000000 0.563780 0.503891 0.340235 0.325494 0.0 1.0 ... 0.0 0.0 0.0 0.0 1.0 0.0 0.0 0.0 1.0 0.0
921 0.249240 0.188679 0.044776 0.500000 0.563780 0.500000 0.333333 0.325494 0.0 1.0 ... 0.0 0.0 0.0 0.0 0.0 1.0 0.0 0.0 1.0 0.0
1356 0.268800 0.592428 0.552759 0.206283 0.563780 0.503891 0.530932 0.325494 1.0 1.0 ... 0.0 0.0 0.0 0.0 1.0 0.0 0.0 0.0 1.0 0.0
566 0.194412 0.451775 0.090358 1.000000 0.905039 0.387288 0.034323 0.323211 0.0 1.0 ... 0.0 0.0 0.0 0.0 0.0 1.0 0.0 0.0 1.0 0.0
1474 0.640924 0.513955 0.524993 0.640982 0.923460 0.503891 0.443506 0.000000 1.0 1.0 ... 0.0 0.0 0.0 0.0 0.0 1.0 0.0 0.0 1.0 0.0
643 0.179500 0.475274 0.378115 0.390373 0.157018 0.503891 0.340235 0.284334 1.0 1.0 ... 0.0 0.0 0.0 0.0 1.0 0.0 0.0 0.0 1.0 0.0
1085 0.170582 0.570549 0.299326 0.708950 0.000000 0.500000 0.857410 0.000000 1.0 1.0 ... 0.0 0.0 0.0 0.0 1.0 0.0 0.0 0.0 1.0 0.0
2071 0.214032 0.307772 0.325643 0.982209 0.563780 0.988758 0.247371 1.000000 0.0 1.0 ... 0.0 0.0 0.0 0.0 1.0 0.0 0.0 0.0 1.0 0.0
626 0.218198 0.708902 0.353481 0.698642 0.630973 0.491986 0.340235 0.001300 1.0 1.0 ... 0.0 0.0 0.0 0.0 1.0 0.0 0.0 0.0 1.0 0.0
1934 0.146526 0.304592 0.478922 0.991521 0.036652 0.503891 0.340235 0.325494 1.0 1.0 ... 0.0 0.0 0.0 0.0 0.0 1.0 0.0 0.0 1.0 0.0

20 rows × 23 columns

Mean Mode with Missingness indicator

What if we can add a bool variable to indicate whether a feature is missing, will that improve our score?

Code
clf, preprocessor = end2end_pipeline(
        num_imputer=SimpleImputer(strategy="mean", add_indicator=True), 
        cat_imputer=SimpleImputer(strategy="most_frequent", add_indicator=True)
)
mean_f1, std_f1 = score_fn_cv(df=df.copy(), clf=clf, target="WeightClass")
scores["Simple Imputation Mean/Mod with missingness"] = mean_f1
stds["Simple Imputation Mean/Mod with missingness"] = std_f1

print(f"Simple Imputation Mean/Mod: F1 score = {100*scores['Simple Imputation Mean/Mod with missingness']:.2f}%")
clf
Simple Imputation Mean/Mod: F1 score = 70.16%
Pipeline(steps=[('preprocessor',
                 ColumnTransformer(transformers=[('num',
                                                  Pipeline(steps=[('encoder',
                                                                   MinMaxScaler()),
                                                                  ('imputer',
                                                                   SimpleImputer(add_indicator=True))]),
                                                  ['Age', 'Height', 'Weight',
                                                   'FCVC', 'NCP', 'CH2O', 'FAF',
                                                   'TUE']),
                                                 ('cat',
                                                  Pipeline(steps=[('ordinal_encode',
                                                                   OrdinalEncoder(handle_unknown='use_encoded_value',
                                                                                  unknown_value=nan)),
                                                                  ('imputer',
                                                                   SimpleImputer(add_indicator=True,
                                                                                 strategy='most_frequent')),
                                                                  ('encoder',
                                                                   OneHotEncoder(drop='first',
                                                                                 handle_unknown='ignore'))]),
                                                  ['Gender', 'FHO', 'FAVC',
                                                   'CAEC', 'SMOKE', 'SCC',
                                                   'CALC', 'MTRANS'])])),
                ('classifier', LogisticRegression(max_iter=2000))])
In a Jupyter environment, please rerun this cell to show the HTML representation or trust the notebook.
On GitHub, the HTML representation is unable to render, please try loading this page with nbviewer.org.

KNN Imputation

KNN imputer replaces missing values with their nearest neighbors.

Code
### KNN Imputation
cat_pipe = Pipeline(
        steps=[("imputer", KNNImputer(n_neighbors=1, add_indicator=True))]
    )
clf, preprocessor = end2end_pipeline(
    num_imputer=KNNImputer(n_neighbors=15, add_indicator=True),
    cat_imputer=cat_pipe
)
mean_f1, std_f1 = score_fn_cv(df=df.copy(), clf=clf, target="WeightClass")
scores["KNN Imputation"] = mean_f1
stds["KNN Imputation"] = std_f1

print(f"KNN Imputation: F1 score = {100*scores['KNN Imputation']:.2f}%")
clf
KNN Imputation: F1 score = 70.96%
Pipeline(steps=[('preprocessor',
                 ColumnTransformer(transformers=[('num',
                                                  Pipeline(steps=[('encoder',
                                                                   MinMaxScaler()),
                                                                  ('imputer',
                                                                   KNNImputer(add_indicator=True,
                                                                              n_neighbors=15))]),
                                                  ['Age', 'Height', 'Weight',
                                                   'FCVC', 'NCP', 'CH2O', 'FAF',
                                                   'TUE']),
                                                 ('cat',
                                                  Pipeline(steps=[('ordinal_encode',
                                                                   OrdinalEncoder(handle_unknown='use_encoded_value',
                                                                                  unknown_value=nan)),
                                                                  ('imputer',
                                                                   Pipeline(steps=[('imputer',
                                                                                    KNNImputer(add_indicator=True,
                                                                                               n_neighbors=1))])),
                                                                  ('encoder',
                                                                   OneHotEncoder(drop='first',
                                                                                 handle_unknown='ignore'))]),
                                                  ['Gender', 'FHO', 'FAVC',
                                                   'CAEC', 'SMOKE', 'SCC',
                                                   'CALC', 'MTRANS'])])),
                ('classifier', LogisticRegression(max_iter=2000))])
In a Jupyter environment, please rerun this cell to show the HTML representation or trust the notebook.
On GitHub, the HTML representation is unable to render, please try loading this page with nbviewer.org.

Iterative Imputation

Code
def get_estimator_name(estimator):
    return str(type(estimator)).split(".")[-1][:-2]


estimators = [
    BayesianRidge(),
    RandomForestRegressor(),
    KNeighborsRegressor(),
]

for estimator in estimators:
    logging.info(f"Iterative Imputation with {get_estimator_name(estimator)}")
    cat_pipe = Pipeline(
        steps=[
            (
                "imputer",
                IterativeImputer(
                    add_indicator=True,
                    estimator=estimator,
                    random_state=42,
                    n_nearest_features=1,
                    sample_posterior=False,
                    initial_strategy="most_frequent",
                    max_iter=20,
                ),
            )
        ]
    )
    clf, pre = end2end_pipeline(
        num_imputer=IterativeImputer(
            add_indicator=True,
            random_state=42,
            n_nearest_features=1,
            sample_posterior=False,
            initial_strategy="mean",
            estimator=estimator,
            max_iter=20,
        ),
        cat_imputer=cat_pipe,
    )
    mean_f1, std_f1 = score_fn_cv(df=df.copy(), clf=clf, target="WeightClass")
    scores[f"Iterative Imputation with {get_estimator_name(estimator)}"] = mean_f1
    stds[f"Iterative Imputation with {get_estimator_name(estimator)}"] = std_f1
    logging.info(
        f"Iterative Imputation with {get_estimator_name(estimator)}: F1 score = {100*scores[f'Iterative Imputation with {get_estimator_name(estimator)}']:.2f}%"
    )
clf
2024-04-29T15:12:52+0300 INFO: Iterative Imputation with BayesianRidge
2024-04-29T15:12:56+0300 INFO: Iterative Imputation with BayesianRidge: F1 score = 67.64%
2024-04-29T15:12:56+0300 INFO: Iterative Imputation with RandomForestRegressor
2024-04-29T15:19:05+0300 INFO: Iterative Imputation with RandomForestRegressor: F1 score = 66.13%
2024-04-29T15:19:05+0300 INFO: Iterative Imputation with KNeighborsRegressor
2024-04-29T15:19:15+0300 INFO: Iterative Imputation with KNeighborsRegressor: F1 score = 67.88%
Pipeline(steps=[('preprocessor',
                 ColumnTransformer(transformers=[('num',
                                                  Pipeline(steps=[('encoder',
                                                                   MinMaxScaler()),
                                                                  ('imputer',
                                                                   IterativeImputer(add_indicator=True,
                                                                                    estimator=KNeighborsRegressor(),
                                                                                    max_iter=20,
                                                                                    n_nearest_features=1,
                                                                                    random_state=42))]),
                                                  ['Age', 'Height', 'Weight',
                                                   'FCVC', 'NCP', 'CH2O', 'FAF',
                                                   'TUE']),
                                                 ('cat',
                                                  Pipeline(steps=[('ordinal_encode',
                                                                   Ordi...
                                                                   Pipeline(steps=[('imputer',
                                                                                    IterativeImputer(add_indicator=True,
                                                                                                     estimator=KNeighborsRegressor(),
                                                                                                     initial_strategy='most_frequent',
                                                                                                     max_iter=20,
                                                                                                     n_nearest_features=1,
                                                                                                     random_state=42))])),
                                                                  ('encoder',
                                                                   OneHotEncoder(drop='first',
                                                                                 handle_unknown='ignore'))]),
                                                  ['Gender', 'FHO', 'FAVC',
                                                   'CAEC', 'SMOKE', 'SCC',
                                                   'CALC', 'MTRANS'])])),
                ('classifier', LogisticRegression(max_iter=2000))])
In a Jupyter environment, please rerun this cell to show the HTML representation or trust the notebook.
On GitHub, the HTML representation is unable to render, please try loading this page with nbviewer.org.

Comparision

Code
scores_df = pd.DataFrame()
scores_df["means"] = list(scores.values())
scores_df["stds"] = list(stds.values())
scores_df *= 100
scores_df.index = list(scores.keys())

scores_df[["means"]].plot.barh(xerr=scores_df["stds"], color="steelblue")
plt.title("Comparision of imputation methods on F1 score")
plt.xlabel("F1 Score, the higher the better")
plt.xlim(0, 100)
# Add annotations
for i, v in enumerate(scores_df["means"]):
    if v == scores_df["means"].min():
        color = "red"
    elif v == scores_df["means"].max():
        color = "green"
    else:
        color = "black"
    plt.text(v + 1, i, " " + str(round(v, 2)) + "%", color=color, va="center");

Summary

  • Simple Imputation Mean/Mod: Missing numerical features are replaced by the mean while missing categorical features are replaced by the mode.

  • Simple Imputataion with Missingness indicator: In addition to replacing with mean/mode, an extra feature is added to indicate the missingness of the feature.

  • KNN Imputation: Nearest neighbors imputation. For numerical features, n_neighbors of 15 is used. For categorical features, nearest neighbors is preceded by ordinal encoding which is a requirement of the sklearn KNNImputer. In case of categorical features, the n_neighbors parameter is set to 1 to avoid averaging categorical values. Another alternative would be to use a custom distance metric that for 2 1-D arrays returns a distance proportional to the frequency of the mode of the categories. With such metric, we can safely try out n_neighbors>1

  • Iterative Imputation: Numerical and categorical features are treated differently. Similar setting as to KNN imputation is used. The strategy to initiliaze numerical features is set to mean and to mode for categorical features.

KNN Imputation has the highest score of imputing the missing values. Iterative imputation in the other hand has the lowest F1 score.

Modelling and Evaluation

Code
from sklearn.inspection import permutation_importance
from sklearn.model_selection import GridSearchCV, KFold

We will reuse the pipeline of KNNNearest Neighbor imputation introduced in KNN Imputation to build on as it yielded the highest performance on F1 score.

Further data Exploration

Weight class distribution

Code
plt.pie(df['WeightClass'].value_counts(), labels=df["WeightClass"].value_counts().index,autopct='%.0f%%', colors=["skyblue", "steelblue", "lightblue", "blue"])
plt.title('Weight Class Distribution among respondents');

Obese respondents are 46%, followed by overweight 27%, normal weight 14% and underweight 13%.

Bar plotting for categorical features

Code
#Defining bar chart function
def bar_plot(feature, df=df, target="WeightClass"):
    sns.countplot(x=target, hue=feature, data=df, palette = "Blues_r")
    plt.title(f"{feature} vs {target}")
    return plt.show()
bar_plot("Gender")
2024-04-29T15:19:16+0300 INFO: Using categorical units to plot a list of strings that are all parsable as floats or dates. If these strings should be plotted as numbers, cast to the appropriate data type before plotting.

Code
fig = px.bar(df["Gender"].value_counts(), labels={'index': 'Gender', 'value': 'Count'}, color=["Male", "Female"], color_discrete_sequence=["steelblue","skyblue"], title='Bar Plot of Gender')
fig.show()

Men tend to be slightly more obese than women. Females tend to be more underweight compared to males. There are almost equal number of male and female respondents.

Code
bar_plot("FHO")
2024-04-29T15:19:16+0300 INFO: Using categorical units to plot a list of strings that are all parsable as floats or dates. If these strings should be plotted as numbers, cast to the appropriate data type before plotting.

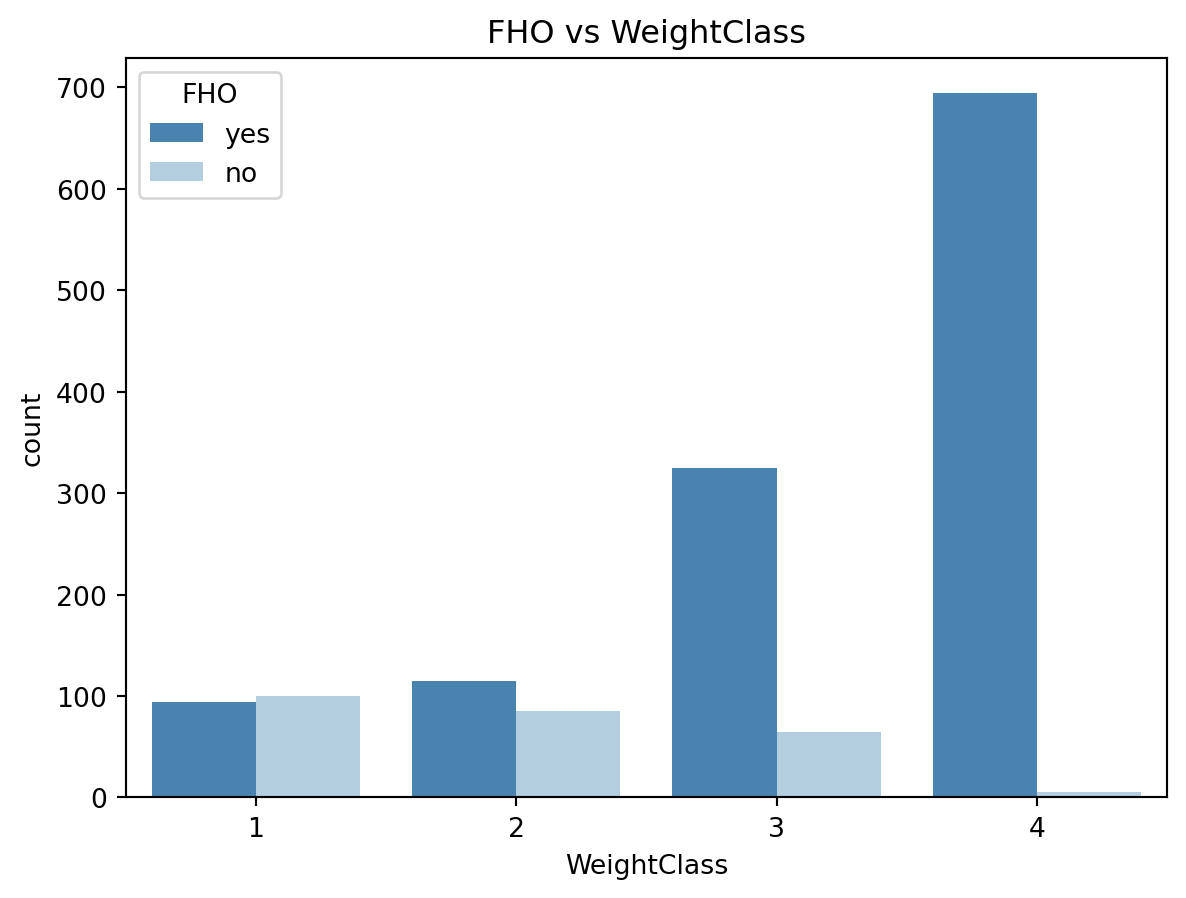
The more obesity / overweight history there is in the family, the more likely it is for respondent to be obese.

Code
bar_plot("FAVC")
2024-04-29T15:19:16+0300 INFO: Using categorical units to plot a list of strings that are all parsable as floats or dates. If these strings should be plotted as numbers, cast to the appropriate data type before plotting.

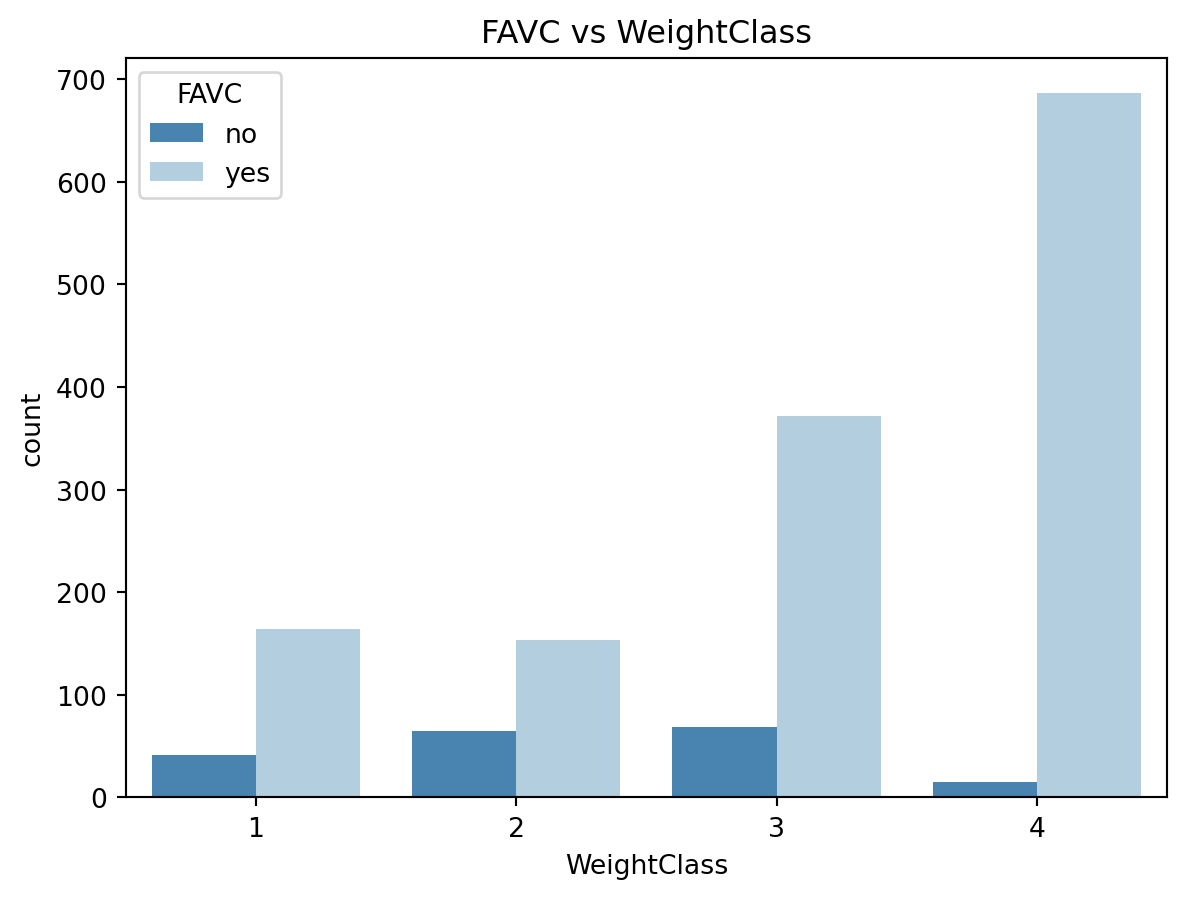
Every weight class consumes high caloric foods but the obese and overweight people tend to consume more than normal and under weights.

Code
bar_plot("CAEC")
2024-04-29T15:19:17+0300 INFO: Using categorical units to plot a list of strings that are all parsable as floats or dates. If these strings should be plotted as numbers, cast to the appropriate data type before plotting.

First we can see that every weight class have foods between meals. People who have food between meals sometimes are the ones more likely to be obese. Meanwhile, People who always have meals between meals tend to be of normal weight- It would be interesting to simplify the feature into binary yes or no.

Code
tmp = pd.DataFrame()
tmp["CAEC"] = df["CAEC"].apply(lambda x: 'no' if x == 'no' else 'yes')
tmp["WeightClass"] = df["WeightClass"]
bar_plot("CAEC", tmp)
2024-04-29T15:19:17+0300 INFO: Using categorical units to plot a list of strings that are all parsable as floats or dates. If these strings should be plotted as numbers, cast to the appropriate data type before plotting.

WIth the simplified option, we clearly see that the obese have more food consumption between meals while normal and underweight classes have almost equals food consumption between meals.

Code
bar_plot("SMOKE")
2024-04-29T15:19:18+0300 INFO: Using categorical units to plot a list of strings that are all parsable as floats or dates. If these strings should be plotted as numbers, cast to the appropriate data type before plotting.

Code
df["SMOKE"].value_counts().plot(kind="bar");
plt.title("Smoke habit in respondents");
plt.ylabel("Count");

Very small number of people smoke. And smokers can belong to the normal weight class as much as they can be obese.

Code
bar_plot("SCC")
2024-04-29T15:19:18+0300 INFO: Using categorical units to plot a list of strings that are all parsable as floats or dates. If these strings should be plotted as numbers, cast to the appropriate data type before plotting.

Respondents who monitor their calorie usage are more likely to be in less dangerous weight classes. There are more people who do not monitor their calorie.

Code
bar_plot("CALC")
2024-04-29T15:19:19+0300 INFO: Using categorical units to plot a list of strings that are all parsable as floats or dates. If these strings should be plotted as numbers, cast to the appropriate data type before plotting.

People who drink alcohol sometimes are dominant within respondents and could face more weight issues than others. However, there are obese people who don’t drink alcohol at all, all this to say that not drinking alcohol is not a sure garantee to obesity.

Code
bar_plot("MTRANS")
2024-04-29T15:19:19+0300 INFO: Using categorical units to plot a list of strings that are all parsable as floats or dates. If these strings should be plotted as numbers, cast to the appropriate data type before plotting.

Code
tmp = pd.DataFrame()
tmp["ACTIVE"] = df["MTRANS"].apply(lambda x: 'yes' if x in ['Walking', 'Bike'] else 'no')
tmp["WeightClass"] = df["WeightClass"]
bar_plot("ACTIVE", tmp)
2024-04-29T15:19:19+0300 INFO: Using categorical units to plot a list of strings that are all parsable as floats or dates. If these strings should be plotted as numbers, cast to the appropriate data type before plotting.

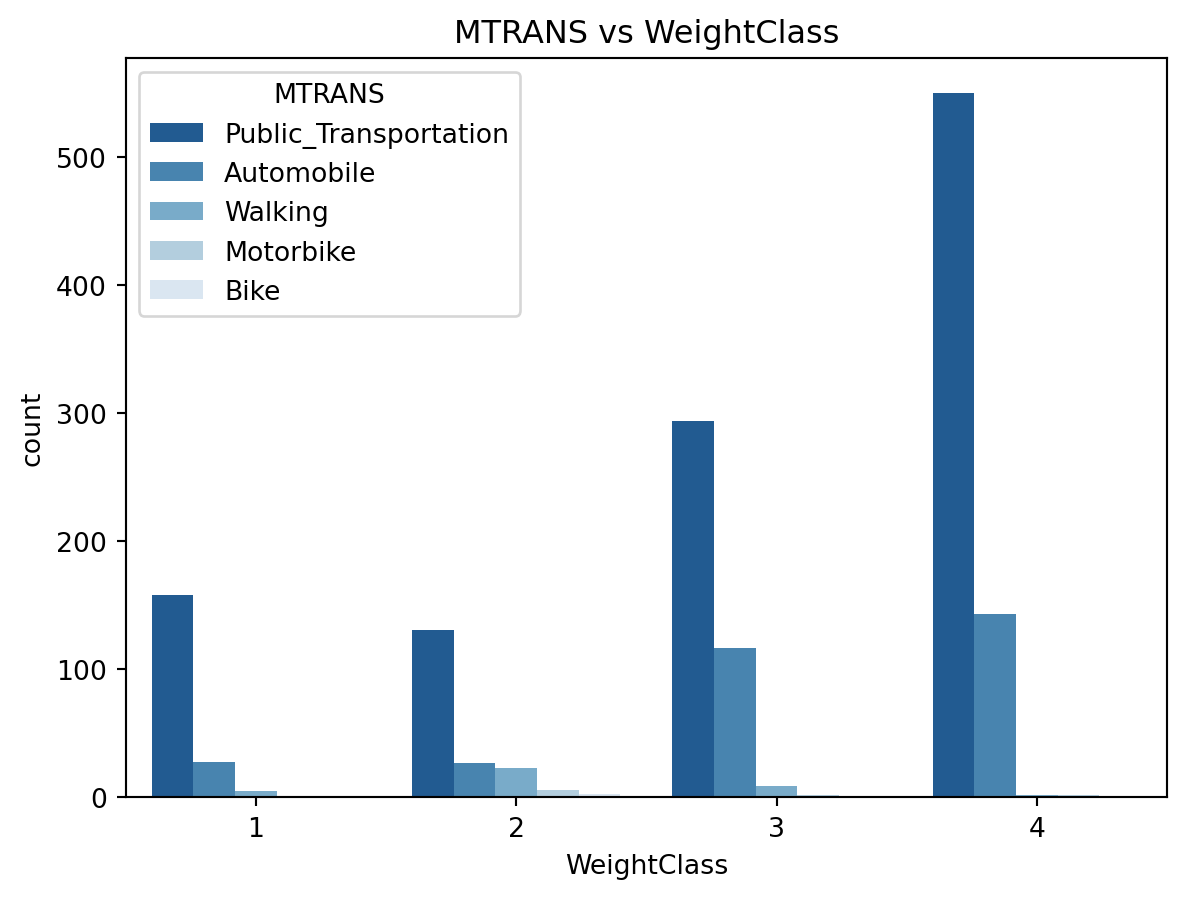
There don’t seem to be any relation between transportation means and weight class. People who use public transport and automabile as well as motorbike can be of overweight and obese classes.

Numerical features distribution

Code
def hist(feature, nbins=7, df=df, target="WeightClass"):
    feature_group = df.groupby([feature, target]).agg({target: 'count'})
    feature_group = feature_group.rename(columns={target: 'Count'})
    feature_group = feature_group.reset_index().sort_values(by=target, ascending=True)
    fig = px.histogram(feature_group, x=feature, y=target, color=target, barmode='group', marginal='box', nbins=nbins, title=f'{target} = F({feature})')
    return fig.show()

hist("Age", 6)
Code
hist("Height", 4)
Code
hist("Weight", 4)
Code
NUM_FEATURES
['Age', 'Height', 'Weight', 'FCVC', 'NCP', 'CH2O', 'FAF', 'TUE']
Code
df[NUM_FEATURES].hist(figsize=(20,20), color='skyblue')
plt.show()

Code
df[["WeightClass"]].hist()
array([[<AxesSubplot:title={'center':'WeightClass'}>]], dtype=object)

Code
px.imshow(df.corr(),  width=700, height=500,color_continuous_scale='blues', title='Correlation between variables')
  • High correlation betwwen Weight and WeightClass which is normal as $ BMI = $
  • High correlation betwwen Height and weight
  • Correlation between Age and WeightClass
  • Correlation between vegatables consumption FCVC and weight
  • Correlation between daily number of meals NCP and height

Data Preprocessing

We will reuse the pipeline used to perform feature imputation by making few modification and then split our dataset into train and test sets.

Code
def end2end_preprocessing(num_imputer, cat_imputer, num_features=NUM_FEATURES, cat_features=CAT_FEATURES):

    numerical_transformer = Pipeline(
        steps=[('encoder', MinMaxScaler()), ("imputer", num_imputer)]
    )

    categorical_transformer = Pipeline(
        steps=[("ordinal_encode", OrdinalEncoder(handle_unknown='use_encoded_value', unknown_value=np.nan)), ("imputer", cat_imputer), ('encoder', OneHotEncoder(drop='first', handle_unknown='ignore'))]
    )
    # 
    preprocessor = ColumnTransformer(transformers=[
        ('num', numerical_transformer, num_features), 
        ('cat', categorical_transformer, cat_features)
    ])
    return preprocessor

del preprocessor
preprocessor = end2end_preprocessing(
    num_imputer=KNNImputer(n_neighbors=15, add_indicator=True),
    cat_imputer=KNNImputer(n_neighbors=1, add_indicator=True)
) 

# Let's split our dataset into train and test split in a stratified way. 

X_train, X_test, y_train, y_test = train_test_split(df.drop("WeightClass", axis=1), df["WeightClass"], stratify=df["WeightClass"], test_size=0.2, random_state=42)

preprocessor
ColumnTransformer(transformers=[('num',
                                 Pipeline(steps=[('encoder', MinMaxScaler()),
                                                 ('imputer',
                                                  KNNImputer(add_indicator=True,
                                                             n_neighbors=15))]),
                                 ['Age', 'Height', 'Weight', 'FCVC', 'NCP',
                                  'CH2O', 'FAF', 'TUE']),
                                ('cat',
                                 Pipeline(steps=[('ordinal_encode',
                                                  OrdinalEncoder(handle_unknown='use_encoded_value',
                                                                 unknown_value=nan)),
                                                 ('imputer',
                                                  KNNImputer(add_indicator=True,
                                                             n_neighbors=1)),
                                                 ('encoder',
                                                  OneHotEncoder(drop='first',
                                                                handle_unknown='ignore'))]),
                                 ['Gender', 'FHO', 'FAVC', 'CAEC', 'SMOKE',
                                  'SCC', 'CALC', 'MTRANS'])])
In a Jupyter environment, please rerun this cell to show the HTML representation or trust the notebook.
On GitHub, the HTML representation is unable to render, please try loading this page with nbviewer.org.

Modelling and Evaluation

We will use RandomForestClassifier as estimator, this can be appended to the preprocessing pipeline defined above.

Code
rfe = Pipeline(
    [
        ("preprocess", preprocessor),
        ("classifier", RandomForestClassifier(n_jobs=4, random_state=42)),
    ]
)
rfe
Pipeline(steps=[('preprocess',
                 ColumnTransformer(transformers=[('num',
                                                  Pipeline(steps=[('encoder',
                                                                   MinMaxScaler()),
                                                                  ('imputer',
                                                                   KNNImputer(add_indicator=True,
                                                                              n_neighbors=15))]),
                                                  ['Age', 'Height', 'Weight',
                                                   'FCVC', 'NCP', 'CH2O', 'FAF',
                                                   'TUE']),
                                                 ('cat',
                                                  Pipeline(steps=[('ordinal_encode',
                                                                   OrdinalEncoder(handle_unknown='use_encoded_value',
                                                                                  unknown_value=nan)),
                                                                  ('imputer',
                                                                   KNNImputer(add_indicator=True,
                                                                              n_neighbors=1)),
                                                                  ('encoder',
                                                                   OneHotEncoder(drop='first',
                                                                                 handle_unknown='ignore'))]),
                                                  ['Gender', 'FHO', 'FAVC',
                                                   'CAEC', 'SMOKE', 'SCC',
                                                   'CALC', 'MTRANS'])])),
                ('classifier',
                 RandomForestClassifier(n_jobs=4, random_state=42))])
In a Jupyter environment, please rerun this cell to show the HTML representation or trust the notebook.
On GitHub, the HTML representation is unable to render, please try loading this page with nbviewer.org.

We can then proceed to use GridSearch to search for the best parameters to fit our estimator.

Code
param_grids = {
    "classifier__n_estimators": [10, 20, 50, 100],
    "classifier__criterion": ["gini", "entropy"],
    "classifier__max_depth": [3, 9, 15, 20]
}
cv = StratifiedKFold(n_splits=N_SPLITS, random_state=42, shuffle=True)

grid_search = GridSearchCV(
        estimator=rfe, 
        param_grid=param_grids,
        return_train_score=True,
        cv=cv,
    ).fit(X_train, y_train)

result = pd.DataFrame(grid_search.cv_results_)
grid_search.best_params_
{'classifier__criterion': 'entropy',
 'classifier__max_depth': 15,
 'classifier__n_estimators': 100}

Now that we have a set of parameters, we can reuse it to fit an estimator as follows.

Code
rfe_model = Pipeline(
    [
        ("preprocess", preprocessor),
        ("classifier", RandomForestClassifier
         (
            criterion=grid_search.best_params_["classifier__criterion"], 
            max_depth=grid_search.best_params_["classifier__max_depth"], 
            n_estimators=grid_search.best_params_["classifier__n_estimators"], n_jobs=8, random_state=42)
        ),
    ]
)
rfe_model.fit(X_train, y_train)
y_pred = rfe_model.predict(X_test)
report = pd.DataFrame(classification_report(y_test, y_pred, output_dict=True))
report
1 2 3 4 accuracy macro avg weighted avg
precision 0.884615 0.760870 0.796610 0.888889 0.8487 0.832746 0.845484
recall 0.851852 0.603448 0.810345 0.943590 0.8487 0.802309 0.848700
f1-score 0.867925 0.673077 0.803419 0.915423 0.8487 0.814961 0.845415
support 54.000000 58.000000 116.000000 195.000000 0.8487 423.000000 423.000000

Overall the model can make an accurate prediction 85% of time. The high performing class is obese with an F1 score of 91% while the normal class is underperforms with a F1 score of 67%.

Code
sns.heatmap(confusion_matrix(y_test, y_pred), annot=True, annot_kws={'size':10},
            cmap=plt.cm.Blues, linewidths=0.2);
tick_marks = np.arange(4)
tick_marks2 = tick_marks + 0.5
plt.xticks(tick_marks, [1,2,3,4], rotation=25)
plt.yticks(tick_marks2, [1,2,3,4], rotation=0)
plt.xlabel('Predicted')
plt.ylabel('Actual')
plt.title('Confusion Matrix on Test data')
plt.show()

Here we can see the most common mistakes are between neighbors classes such as Obese being falsely predicted as overweight and vice-versa.

Code
# Tree Visualisation
from sklearn.tree import export_graphviz
from IPython.display import Image
import graphviz
for i in range(1):
    tree = rfe_model[-1].estimators_[i]
    dot_data = export_graphviz(tree,
                               feature_names=preprocessor.get_feature_names_out(),  
                               filled=True,  
                               max_depth=3, 
                               impurity=False, 
                               proportion=False)
    graph = graphviz.Source(dot_data)
    display(graph)

Code
result = permutation_importance(
    rfe_model, X_test, y_test, n_repeats=10, random_state=42, n_jobs=8
)

sorted_idx = result.importances_mean.argsort()[::-1]
forest_importances = pd.Series(result.importances_mean[sorted_idx], index=X_train.columns[sorted_idx])
fig, ax = plt.subplots()
forest_importances.plot.bar(yerr=result.importances_std[sorted_idx], ax=ax, color="skyblue", orientation="vertical")
ax.set_title("Feature importances using permutation")
ax.set_ylabel("Decrease importance, the higher the better")
fig.tight_layout()
plt.show()

We can perform a permutation test on test data using a random forest classifier. The idea of permutation test is to break the association of a given feature with its corresponding weight class and then observe the effect on accuracy. The accuracy of important features will decrease while it will remain unchanged on unimportant feature. A decrease is accuracy hence relate the importance of the feature.

Weight, food consumption between meals CAEC, Age, Height are the most important features followed by food habits such frequency of of vegetable FCVC or daily consumption of water CH20.

The features with the least importance are Smoking habit and Transportation means. As revealed in data exploration.

Next

  • Simplify Age into age category

  • Add BMI as a feature

  • Try more models

  • Train on the most important features only

Thank you for following along :)